
A plain guide to chart pattern hit rates.
This site counts how often classic patterns on ten Indian large-cap stocks and the Nifty IT index did what the textbooks say, under one fixed definition of a hit, and explains why that is not the same as a profitable trade.
Three ways in
What this site counts, and what it will not count
The site does one thing. It runs written rules for seven chart models over ten years of daily prices, counts every figure a rule finds, and judges each one by a single fixed definition of a hit. The result is a table: how many occurrences, how many hits, what share, and what the same test would have scored from any session.
It will not count a figure that a rule did not find, however recognisable it looks by eye. It will not count a pattern from memory, a screenshot or a textbook. It will not publish a forecast, a signal or a ranking of patterns. And it will not change the definition after seeing the numbers, which is the one discipline that makes a hit rate worth reading at all. A rate computed with a definition that was adjusted until it looked good measures the adjustment.
Eleven instruments, ten years
The prices are ten Indian large-cap stocks and one index: Reliance Industries, HDFC Bank, ICICI Bank, Infosys, Tata Consultancy Services, State Bank of India, ITC, Larsen & Toubro, Axis Bank, Bharti Airtel and the Nifty IT index. Each has daily open, high, low and close bars from 7 November 2016 to 5 November 2026, read once from Yahoo Finance on 6 November 2026 and stored by the site.
That is the whole universe. It is not the Indian market, and the page for each model says which of the 11 instruments produced which occurrences. Eleven series that largely move with the same market also overlap in time: when several stocks fall together in the same weeks, the occurrences they produce are not independent of each other, and a count that looks like many cases may be fewer. The site names this limit instead of hiding it.
A hit, in plain words and in rupees
The definition is three numbers: 2 ATR, 1 ATR and 20 sessions. ATR is the average true range of the last 14 sessions, the typical size of one day's movement at that moment, so the same definition scales to a calm stock and a restless one.
Here is how it works on the example drawn on the page about how a hit is counted. A bearish engulfing pair on Reliance Industries was completed on 22 January 2021 at a close of 945.89, with an ATR of 24.17. The target is therefore 2 ATR, or 48.34, below: a close at 897.55 or lower. The cancel level is 1 ATR, 24.17, above: a close at 970.06 or higher. Whichever of the two came first in the next 20 sessions decided it. On 25 January a close beat the target, and the occurrence is a hit. Closes decide, never an intraday high or a low.
The yardstick beside every share
A share such as 50 percent sounds like skill until it is set beside what chance would give. For that reason the same test, with the same three numbers, was run from every session of the same histories, once for each direction, with no figure involved. Across 26,729 sessions on the 11 instruments, an entry would have reached 2 ATR up before 1 ATR down in 38.0 percent of cases, and 2 ATR down before 1 ATR up in 27.8 percent.
The two numbers differ: over these histories the upward test is passed more often than the downward one, and the site does not try to explain why. Every figure on the site is compared with the yardstick of its own direction, a bullish pair against 38.0 and a bearish pair against 27.8, so that the gap between the two directions does not flatter either.
What forty-nine counted occurrences look like
Across all seven models, the rules found 51 figures; 49 of them had the full 20 sessions of history after them and were counted. Of those 49, 17 were hits, 27 were misses and 5 were undecided, which is a share of 34.7 percent.
If each of the 49 had started from a random session in its own direction, the yardsticks predict about 15.6 hits. The rules found 17. The difference is under two occurrences, well inside what luck allows on a sample this size, so the honest summary is that taken together the written rules did about as well as starting on any day. That is a finding about this definition on these 11 instruments. It is neither an endorsement nor a refutation of any of the patterns, and each page says so for its own model.
Why a small sample makes a rough share
Most of the counts are tiny. Six head and shoulders, three double tops, eight double bottoms, four ascending triangles, two descending triangles, eight bullish engulfing pairs and twenty bearish ones. On six occurrences each result is worth almost 17 points of share; on two, 50.
A reader can test the idea on any row of any table: change one result in the mind and see how far the share moves. Where it moves by more than the gap to the yardstick, the row has no message. That is true of nearly every row on the site, and the pages say it plainly, row by row, instead of printing a share and letting it look more solid than it is. The only large count, nineteen bearish pairs, overlaps in time and so carries less weight than its size suggests.
Why an undecided figure counts against
Sometimes neither the 2 ATR target nor the 1 ATR cancel level is reached within 20 sessions. Those occurrences are called undecided. Five of the 49 counted were undecided, three of them bearish engulfing pairs.
An undecided figure counts as not a hit and stays in the denominator. The alternative, dropping it, would let a measurer remove every case that did not resolve quickly and report a better share. Keeping it makes the window part of the claim: a pattern that hits only if you wait longer than 20 sessions is not a hit under this definition. Occurrences with fewer than 20 sessions of history after them are different. They are left out of the shares and counted separately, because the window could not be finished: one double bottom and one bearish engulfing pair.
Bars with no range
The price source sometimes prints a bar whose high equals its low: an exchange holiday or an empty day filled with one price. Such a bar carries no session, and left in the history it would distort the ATR that every threshold uses. Before any rule runs, these bars are removed. In total 19 bars were left out across the 11 instruments: two on each of nine stocks, one on ITC and none on Nifty IT.
The step is the same for every rule and happens before any count, so it cannot favour a result. A reader who lines up a chart here with a platform's chart may find a date missing; nothing traded on it. The history that remains has between 2,468 and 2,471 bars per instrument, ten years of sessions.
A hit rate is not a profit
The last page of the site sets the share of hits beside the average result in ATR. They do not move together. Bullish engulfing hit half the time with an average of +0.57 ATR; double bottom hit less often, 42.9 percent, with a higher average, +0.63 ATR; bearish engulfing hit 36.8 percent and still averaged +0.25.
The costliest miss in the count was a bearish engulfing pair on Bharti Airtel, decided on 12 September 2024 by a close 2.50 ATR against its completing close, although the definition's cancel level is 1 ATR. No cost is deducted anywhere on the site: no spread, commission or financing charge. A share of hits says how often a target came before a cancel level. It says nothing about the size of the losses, and a reader who skips that distinction will read the table wrongly.
Where the broker page fits
The site links to one broker, FxPro, from the button in the header and from the call to action at the foot of each page. The link is an advertising relationship: if a reader opens an account through it, the site is paid. The broker page explains what the account is, what a contract for difference is and is not, and what to read in the terms from India before sending money.
None of the counting pages needs the account. Every table, rule and definition is on the pages themselves. The order ticket on a trading platform asks for a size, a stop and a take profit, which are precisely the decisions a hit-rate table cannot make for anyone.
Six pages, each a count on real price history
Every figure here was found by a written rule on the daily history this site keeps for Reliance Industries, HDFC Bank, ICICI Bank, Infosys, Tata Consultancy Services, State Bank of India, ITC, Larsen & Toubro, Axis Bank, Bharti Airtel, Nifty IT, then judged by one fixed definition of a hit. Open a card for the counts, the rule and the definition.
- How a hit is countedReliance Industries · 9 Dec 2020 – 8 Feb 2021
- Head and shouldersNifty IT · 29 Sep 2021 – 10 Jun 2022
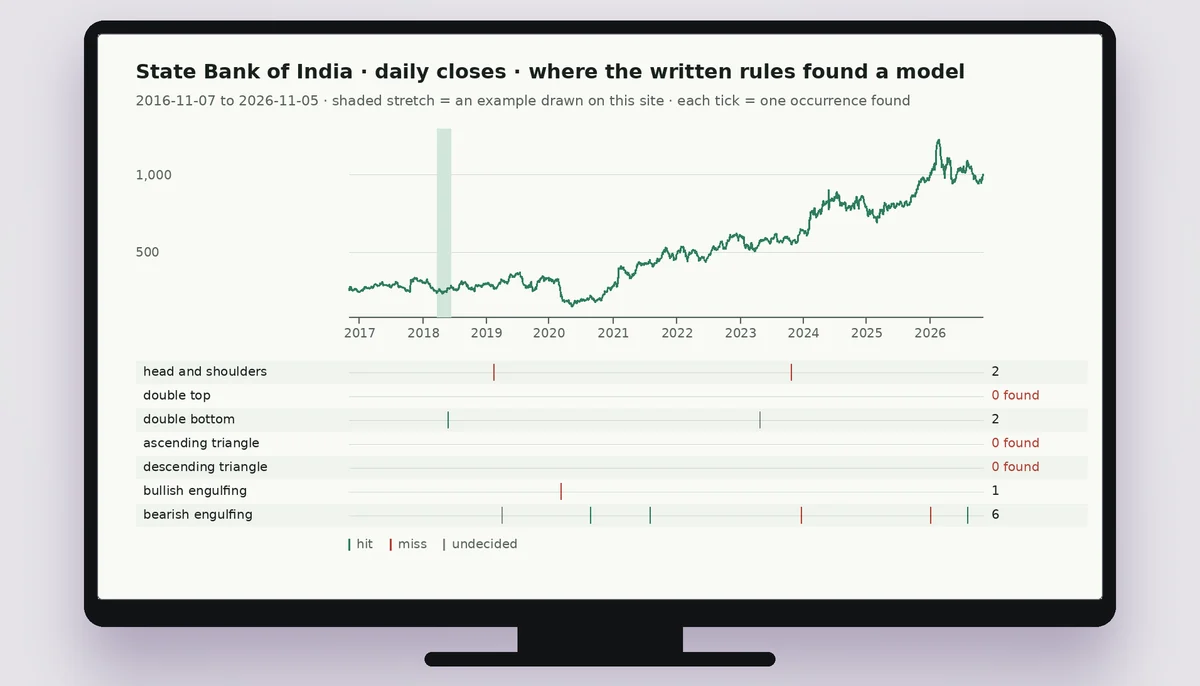
- Double top/bottomState Bank of India · 7 Mar – 20 Jun 2018
- TrianglesInfosys · 27 Nov 2017 – 27 Jun 2018
- EngulfingICICI Bank · 18 Aug – 24 Oct 2025
- Hit rate vs profitBharti Airtel · 18 Jul – 19 Sep 2024
What each page explains
How a hit is counted
The definition in numbers: 2 ATR, 1 ATR and 20 sessions, one real hit and one real miss, and the yardstick from any session.
02Head and shoulders hit rate
Six head and shoulders tops in ten years on 11 instruments: one hit, five misses, and why six occurrences prove little.
03Double top and bottom hit rate
Three double tops and eight double bottoms counted separately, each beside the yardstick of its own direction.
04Triangle hit rate
Four ascending and two descending triangles: how many broke 2 ATR the textbook way before 1 ATR against.
05Engulfing hit rate
Eight bullish and twenty bearish engulfing pairs, the largest sample on the site, and why even that is small.
06Hit rate is not profit
All seven models side by side, share of hits against average result in ATR, and the costliest miss.
Open a practice account with FxPro
A chart pattern is not an order. An order is placed on a platform, carries its own stop and take profit, and has costs. A practice account lets you see the order ticket and the platforms before any money is at stake.